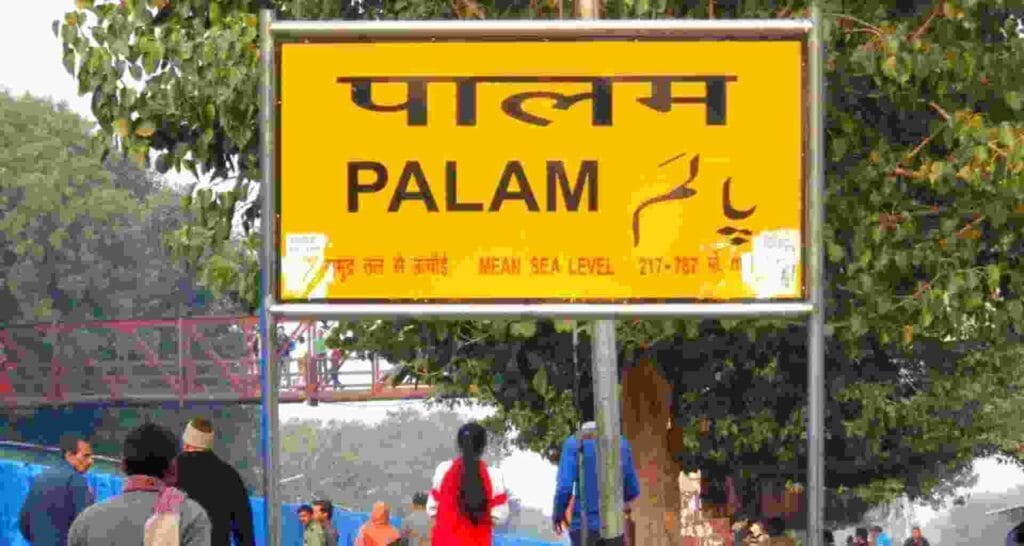
The Palam Assembly constituency, one of the 70 legislative constituencies in Delhi, holds significant importance in the political landscape of the National Capital Territory. Nestled in South West Delhi, it forms a crucial part of the South Delhi Parliamentary seat.
Historical Evolution of Palam Assembly constituency
The present structure of the Palam constituency emerged in 2008 following the recommendations of the Delimitation Commission of India, constituted in 2002. Initially, it was part of the erstwhile Outer Delhi Parliamentary constituency before merging into the South Delhi Lok Sabha seat.
Caste Impact: The caste matrix plays a pivotal role in election outcomes.
Palam’s political landscape embodies diverse dynamics, reflecting Delhi’s multifaceted voter behavior. By analysing past data and understanding current trends, stakeholders can gauge the constituency’s evolving political scenario.
Gokalpur (SC) Assembly Constituency is one of the 70 assembly constituencies in Delhi, India. It falls under the North East Delhi Lok Sabha constituency. The […]
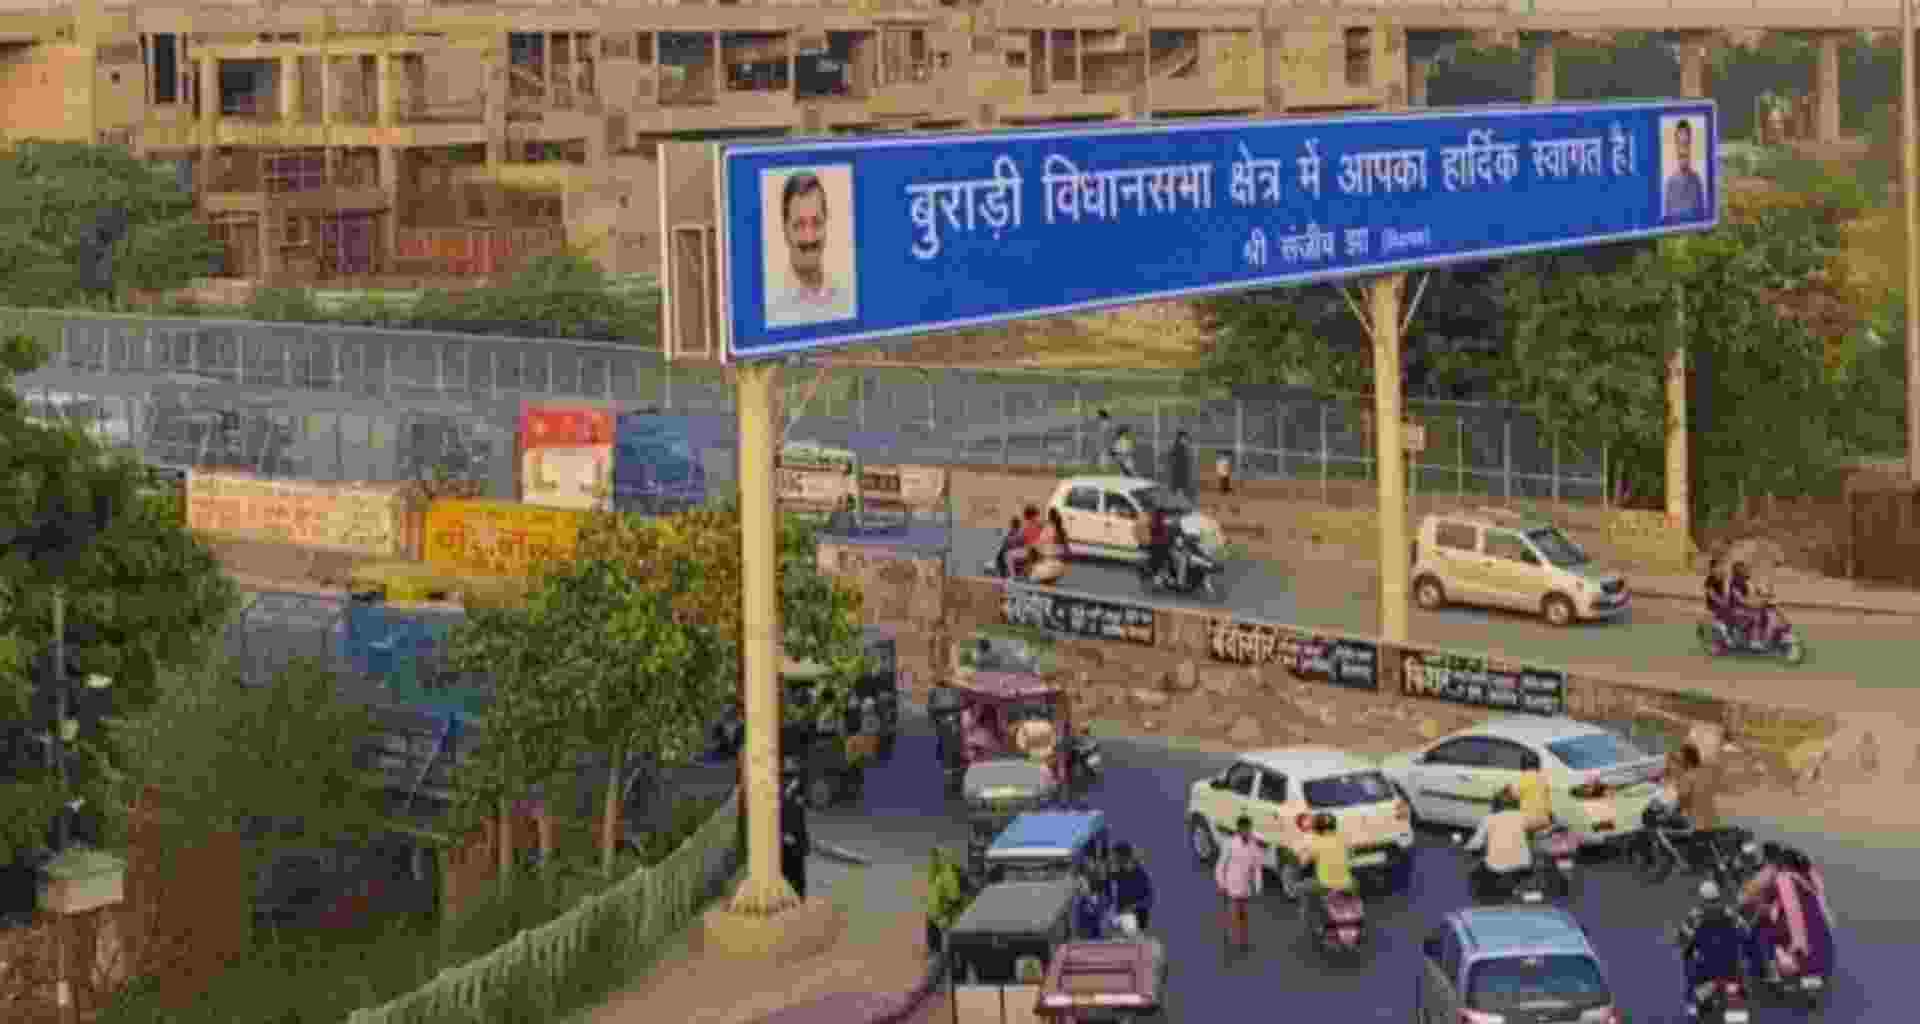
Burari Assembly constituency, situated in the heart of Delhi, falls under the North East Delhi Lok Sabha constituency. It is a General category assembly seat, […]
Adarsh Nagar Assembly constituency is one of the 70 assembly constituencies in Delhi, India. It is situated in North Delhi and falls under the Chandni […]